跳到主要內容
支援知識庫

如何在 Intel® Extreme Tuning Utility(Intel® XTU)中查看處理器頻率及其他參數

內容類型: 疑難排解   |   文章 ID: 000028519   |   最近查看日期: 2026 year 08 month 19 day

環境

作業系統

Windows® 10, 64-bit*
所有由 Intel® Extreme Tuning Utility(Intel® XTU)支援的 Intel® 處理器

說明

我該如何在 Intel® Extreme Tuning Utility(Intel® XTU)使用者介面中查看頻率及其他參數?

解決方法

® Intel 極限調校工具(Intel® XTU)支援於處理器編號中包含 「K」 後綴的 Intel® 處理器型號。請參閱 如何識別我的 Intel® 處理器

查找 Intel® XTU 支援的處理器清單

要監控處理器頻率、圖形頻率、溫度、記憶體頻率及其他參數®,請依照以下步驟操作:

  1. 下載 與安裝 Intel® 極限調校工具(Intel® XTU)。
  2. 啟動 Intel 極限調校工具(Intel XTU)。
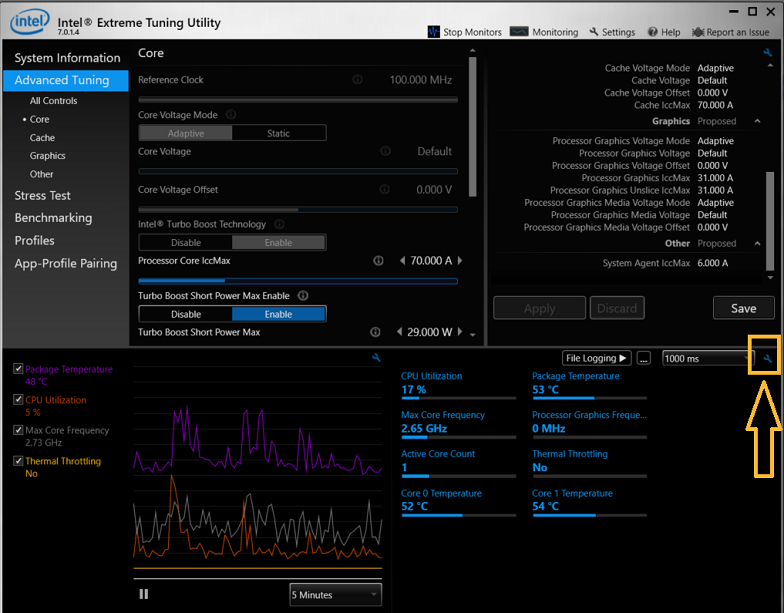
  3. 系統資訊 區塊右下角, 點擊 系統監控視窗右上角的選單圖示(三條橫線)。

    Screenshot of the Intel System Monitor interface showing the Menu icon (three horizontal lines) in the upper-right corner, with options for Configure System Monitors and Configure System Graphs displayed.

  4. 此選單顯示以下選項:
    • 設定系統監控器: 選擇要顯示的系統監控參數。
    • 設定系統 圖表:選擇圖表以顯示並自訂顏色。
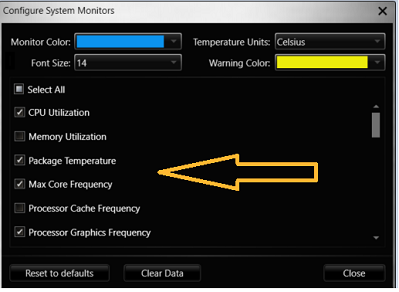
  5. 選擇設定系統監控器」或「設定系統圖表」。
  6. 選擇 你想顯示的參數。

Configure System Monitors window showing selectable system monitoring options Configure System Graphs window with selectable system graph options and color settings.

免責聲明

這個頁面的內容綜合了英文原始內容的人工翻譯譯文與機器翻譯譯文。本內容是基於一般資訊目的,方便您參考而提供,不應視同完整或準確的內容。如果這個頁面的英文版與譯文之間發生任何牴觸,將受英文版規範及管轄。 查看這個頁面的英文版。